About this Event
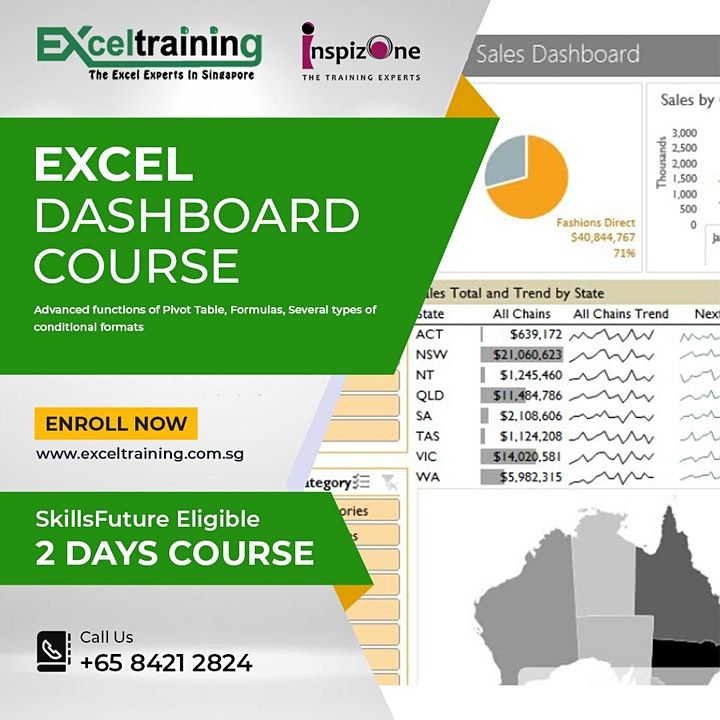
In this Excel dashboard course we will train you how to create dashboard in Excel by summarize the data in Excel worksheet. We will explain using the Excel tables, the most efficient way to store and present the data in Excel as a dashboard. We will teach you pivot tables, several types of conditional formats, and how to summarize your data using charts.
Microsoft uses very advanced functions of Pivot Table, Formulas, Several types of conditional formats, and how to summarize your data using charts. & Charts used for your management reports like Accounting, Finance, Profit & Loss, Sales & Marketing.
After Excel Dashboard Course You will be able to know:
- How to create dashboard in Excel
- Link worksheet data to cells and shapes
- Hide and filter table data
- Changing the Excel program window to meet your needs

Event Venue & Nearby Stays
SkillsFuture Approved Basic to Advanced Excel Course Singapore, 10, 26-11, Anson Road, Singapore, Singapore
SGD 450.00
