About this Event
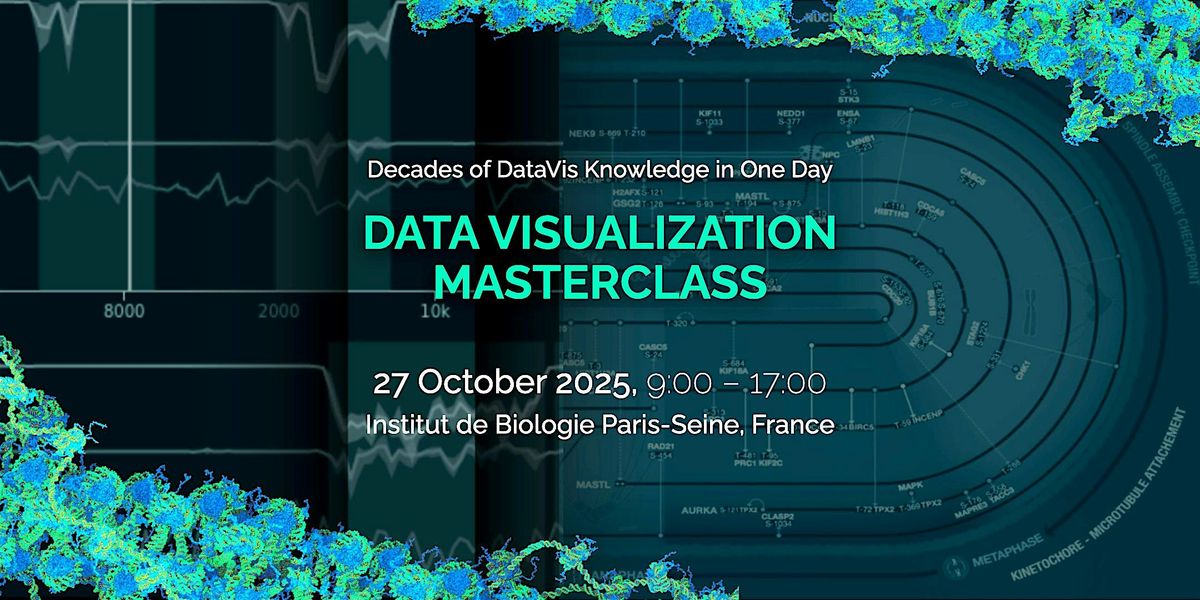
Data Visualization Masterclass ()
Data visualization is essential for validating datasets, verifying AI-driven insights, and communicating your findings. The Data Visualization Masterclass series offers you the opportunity to rapidly learn key principles, methods, and tools from leading international experts.
How is the Masterclass structured? The Masterclass format has evolved over ten years of delivering events worldwide, shaped by feedback from instructors and over 1,000 participants. We select leading practitioners and ask them to share their most valuable insights, distilling decades of experience into a few hours. This intensive, in-person experience covers foundational principles, cutting-edge techniques, and personalized guidance to help you tackle your specific visualization challenges.
Is the Masterclass for me? If you work with large or complex datasets—whether you're a data analyst, programmer, or scientist—this Masterclass is designed for you. The course also covers data-driven storytelling, so will be valuable for designers, visual artists, as well as marketing and communications professionals.
What will I learn? This event will cover:
- Visualization principles
- Strategies for complex data
- Case studies (visual challenges from participants)
- Data-driven storytelling
Can I bring my own data? You can present your data visualization challenges in a ~1 minute “lightning talk” with up to three slides. The Masterclass will have limited capacity to facilitate feedback from the speaker and other participants.
Can I get the fee reimbursed? You'll receive a certificate of completion, which you can use to apply for reimbursement from your employer. To support your reimbursement request to your employer, download the DataVis Masterclass Prospectus (PDF | Word | Text/RTF).
To learn more:
Agenda
🕑: 08:00 AM - 09:00 AM
Arrival and check-in
Info: Location: Institute de Biologie Paris-Seine (IBPS)
🕑: 09:00 AM - 10:30 AM
DataVis principles & AI
Host: Seán O'Donoghue
Info: Visualization is crucial for exploring complex datasets, yet creating clear, effective visuals can seem daunting. This talk aims to demystify the process by discussing principles, methods, and tools for crafting exemplary biological data visualizations. Learn how visual perception limitations, illustrated by optical illusions, inform techniques to enhance clarity. While focusing on 2D data, we extend to 3D and multidimensional visualizations. Additionally, we explore how knowledge of visualization principles and methods can be leveraged with recently emerging AI tools and resources.
🕑: 10:30 AM - 11:00 AM
Meet-the-speaker (optional) and Coffee Break
🕑: 11:00 AM - 12:00 AM
Design & typography
Host: Christian Stolte
Info: Picking up after the break, we will explore how attributes like color, value, and scale influence emphasis and meaning. Composition principles—including Gestalt principles, unity, and balance—help organize visual elements effectively. We will then shift to interactive visualization, considering how content functions as an interface and how additional control elements enhance exploration. Finally, we will cover design strategies for big data, addressing ways to manage complexity while maintaining clarity. By the end, you will have a stronger framework for designing effective and engaging data visualizations.
🕑: 12:00 PM - 12:30 PM
Lightning talks
🕑: 12:30 PM - 01:30 PM
Lunch and Meet-the-speakers
🕑: 01:30 PM - 03:00 PM
Case studies (interactive)
Host: Seán O'Donoghue
Info: This interactive session focuses on real-world case studies, drawing from both our own experiences and those submitted by participants. We begin by exploring key challenges in visualizing 2D, 3D, and multidimensional data, highlighting specific issues we have encountered in practice. The majority of the session will be a moderated discussion centered on participant-submitted examples, encouraging open dialogue and peer input. We will provide structured feedback and guide contributions to ensure a productive exchange, where all participants can share ideas, gain insights, and explore innovative solutions to complex visualization challenges.
🕑: 03:00 PM - 03:30 PM
Meet-the-speaker (optional) and Coffee break
🕑: 03:30 PM - 05:00 PM
Visual storytelling
Host: TBA
🕑: 05:00 PM - 08:00 PM
Reception
Info: Location: TBA
Event Venue & Nearby Stays
Sorbonne University, 4 Place Jussieu, Paris, France
EUR 80.00 to EUR 440.00