Advertisement
What’s the beauty of a box plot? And why should the use of 3D-charts be punishable by law? These questions, and more, will be addressed in our visualisation of quantitative data workshop!
Held by statistics professor Johannes von Engelhardt, this interactive workshop will start off with a brief introduction to data types and basic principles of visual perception.
Then, some of the most common types of graphical representation and their respective functions will be analysed. For each type of visualisation, its use, some possible pitfalls, and how to avoid them, will be determined.
Furthermore, Johannes will make use of real life examples in order to determine how to make visualisations more effective, intuitive and, yes, pretty. :))
Not only focused on theory, through this workshop you will have the chance to create and discuss your own visualisations. In the workshop, students will make use of Microsoft Excel and the online tool datawrapper.de in order to apply all they have learnt.
Sign up through our website: https://tdp-pple.com/tdp-events
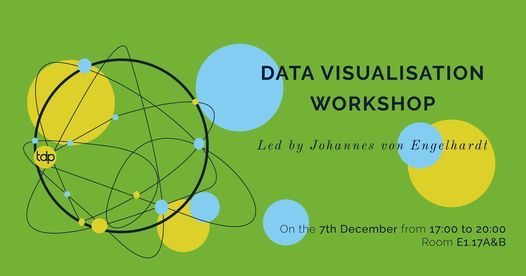
Date: the 7th December
Time: 17:00-20:00
Location: room E1.17A&B
Advertisement
Event Venue & Nearby Stays
Roetersstraat 11, 1018 WB Amsterdam, Nederland, Amsterdam, Netherlands
Tickets