About this Event
Over the years we’ve held Chart Champ all over the place: The Harpoon Brewery, Gillette Stadium, and Fenway Park, to name a few. Then of course we held an online event, and eventually dipped our toe back into in-person events last year at the social-distancing friendly Mendon Drive-In.
This year, we think the time is right to go back to where it all started – Fenway Park – and celebrate the return to public life with a challenge: who can create the best dashboard using Analyze Boston – the city’s open data hub!
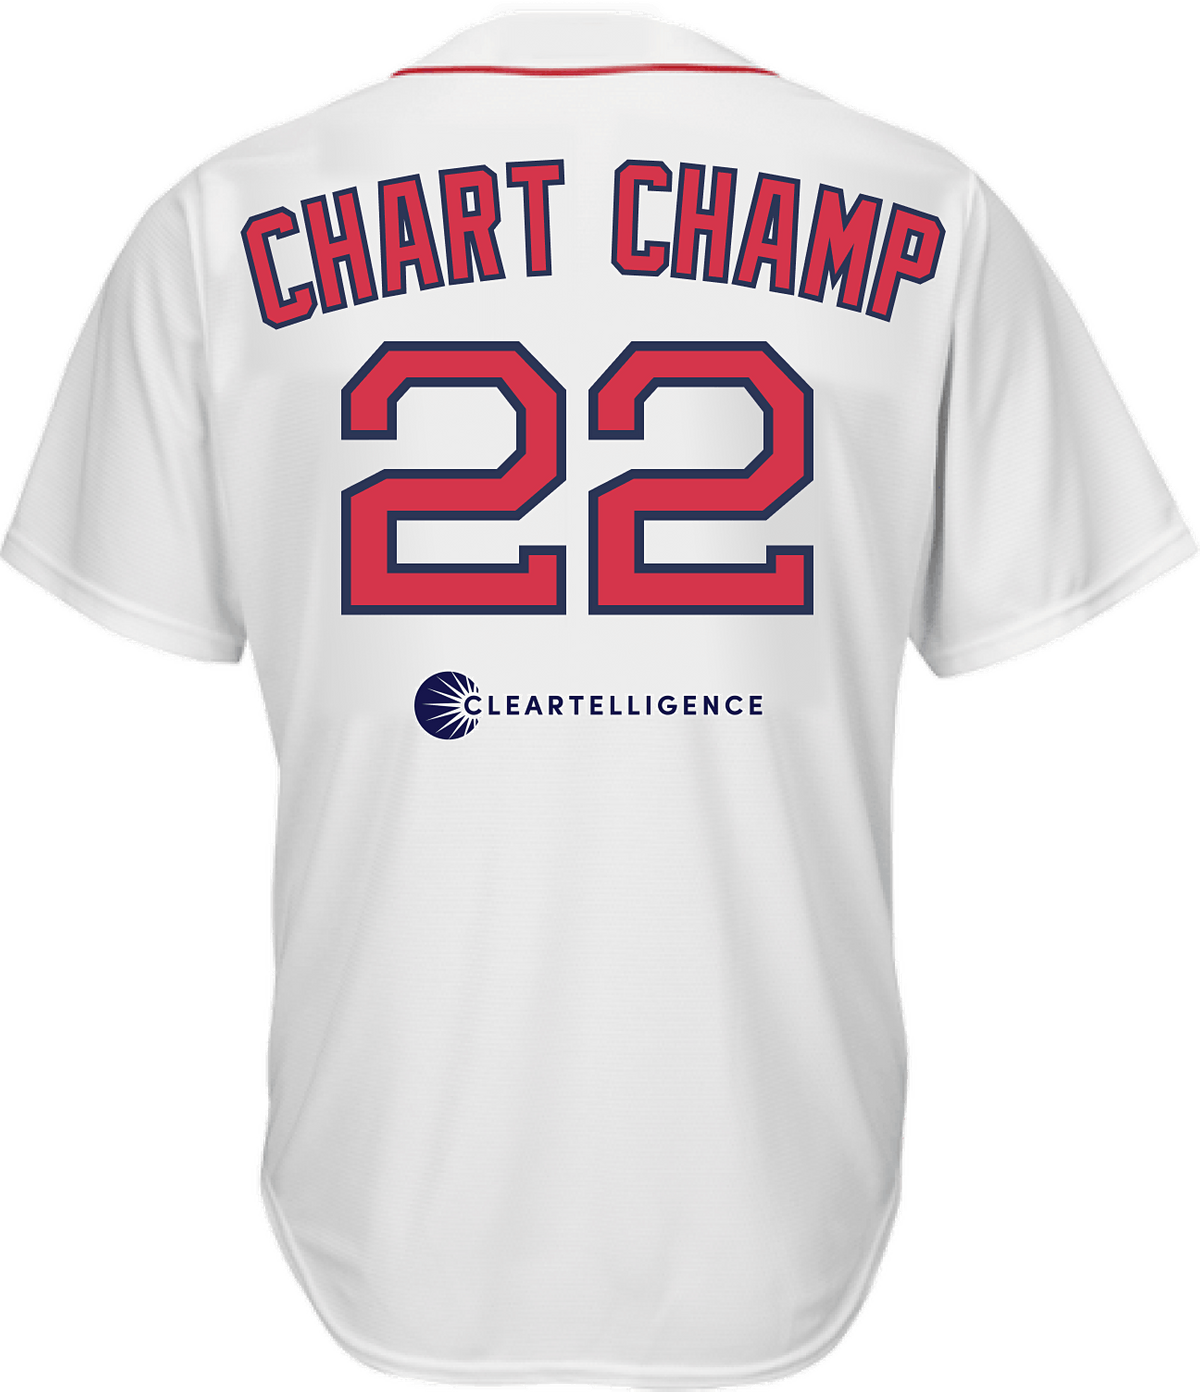
Cleartelligence is pleased to announce its 7th Annual Chart Champ: Back in Public.
When: September 22, 2022, from 12-6pm
Where: Fenway Park’s State Street Pavilion Club – Boston, MA
How it WorksRegister
• Entering the competition? Register here.
• Attendees, please register here.
Ground Rules
• Must be an adult human (18+)
• Must be only one adult human (no teams)
• Must be only one adult human who does not work for Tableau
• One dashboard per contestant
• Dashboards must be one page only
• Workbooks must be submitted via Tableau Public - Email your submission link to [email protected]
Get the Data
Analyze Boston is an amazing resource for the city of Boston’s public data. There you will find data related to City Services, Financials, Environmental, and much more! This year, we challenge our contestants to create a compelling viz using an Analyze Boston dataset they find compelling.
Build & Submit
You must build and submit your dashboard to us by September 1, 2022. Dashboards should be published to Tableau Public and the link should be emailed to [email protected]
Attend the Event
You must be in attendance in order to qualify for the contest. You will be presenting your dashboard in front of the audience and judges.
Presentation
Competitors should prepare a 5-minute presentation. The presentation is going to be quick, so time yourself when you are practicing! The presentation should be structured using the below categories.
• What did you create?
• Who is the audience?
• What is the goal?
Judging
Dashboards will be judged on three key areas:
• Design (25%) – Make it look spiffy, people like looking at pretty things
• Functionality (25%) – Make it cool and functional, its Tableau :
• Storytelling / Usability (50%) – The dashboard should tell a story and allow users to dive into the data!
A finalist pool will be chosen prior to the event and those finalists will need to be present at the event to qualify for the grand prize! The finalists will give a very brief presentation at the event (~five minutes). After final presentations, final scoring will be assessed and the winner will be announced!
Prizes
• 1st Place: $1,000 Amazon Gift Card
• 2nd Place: $300 Amazon Gift Card
• 3rd Place: $150 Amazon Gift Card
Event Venue & Nearby Stays
Fenway Park, 4 Jersey Street, Boston, United States
USD 0.00
